I was approached by Artswork for a poster, but after we got talking about their business and the services they offer I realised there was an interesting opportunity.
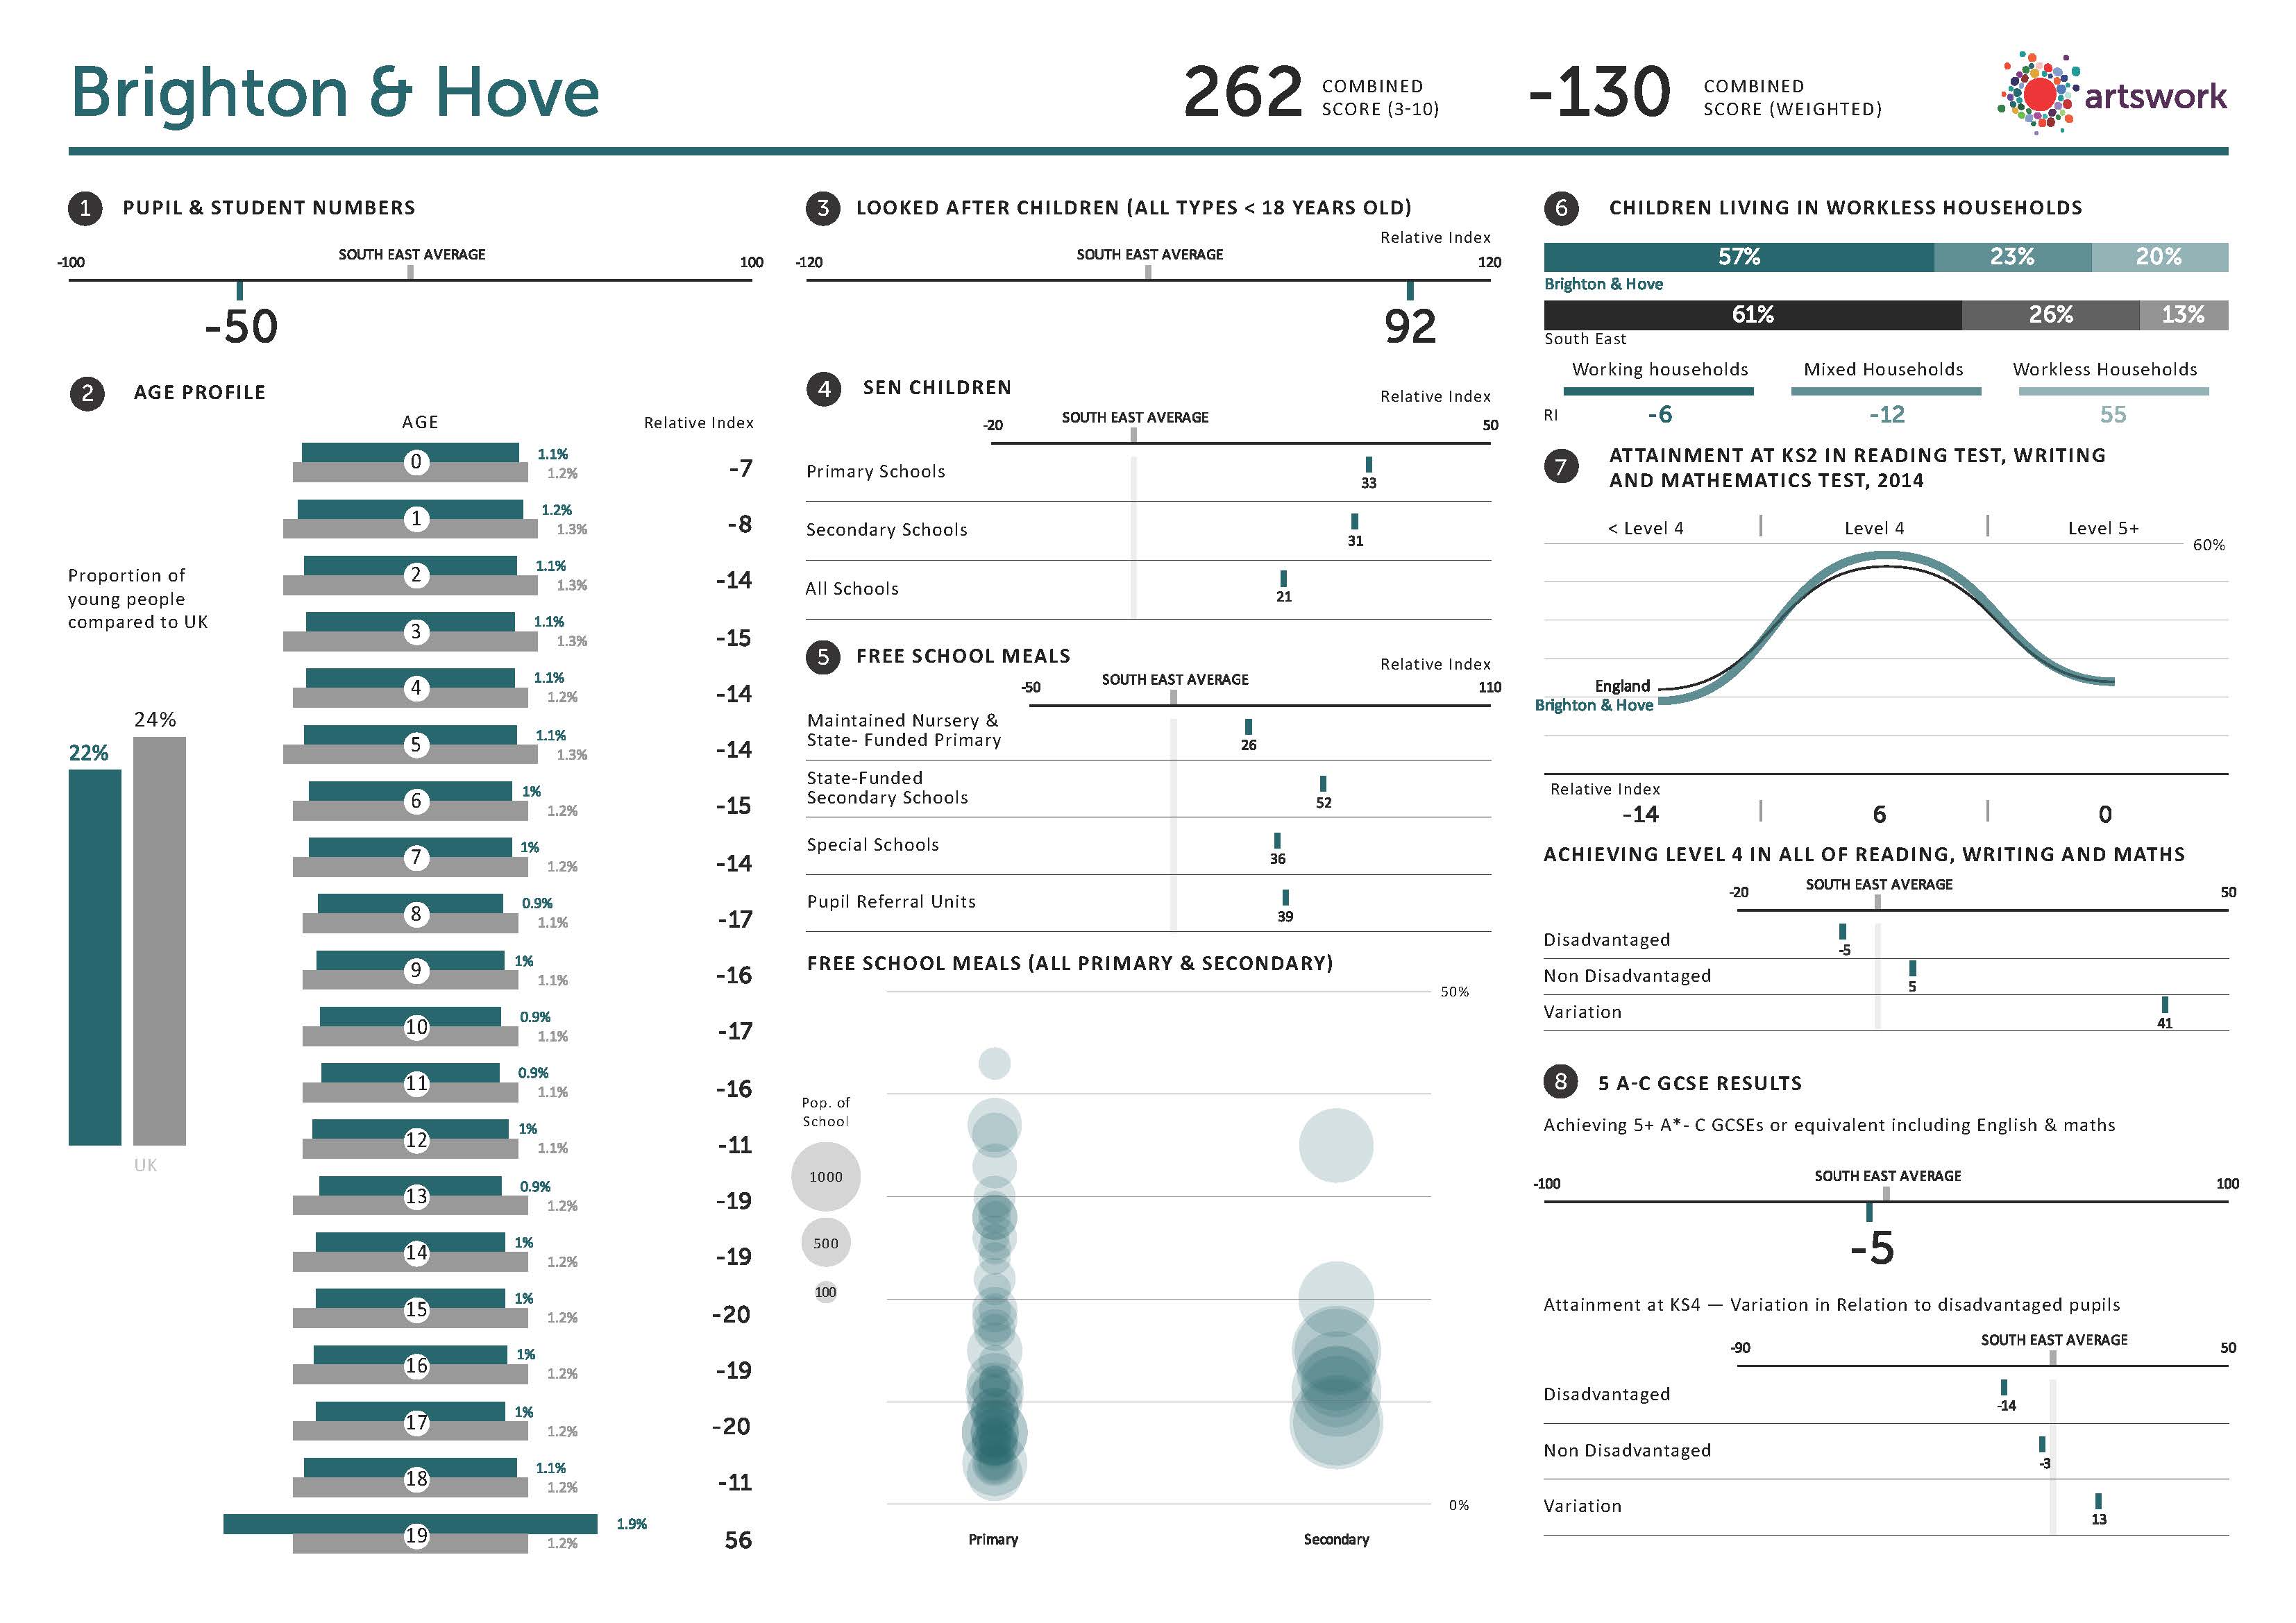
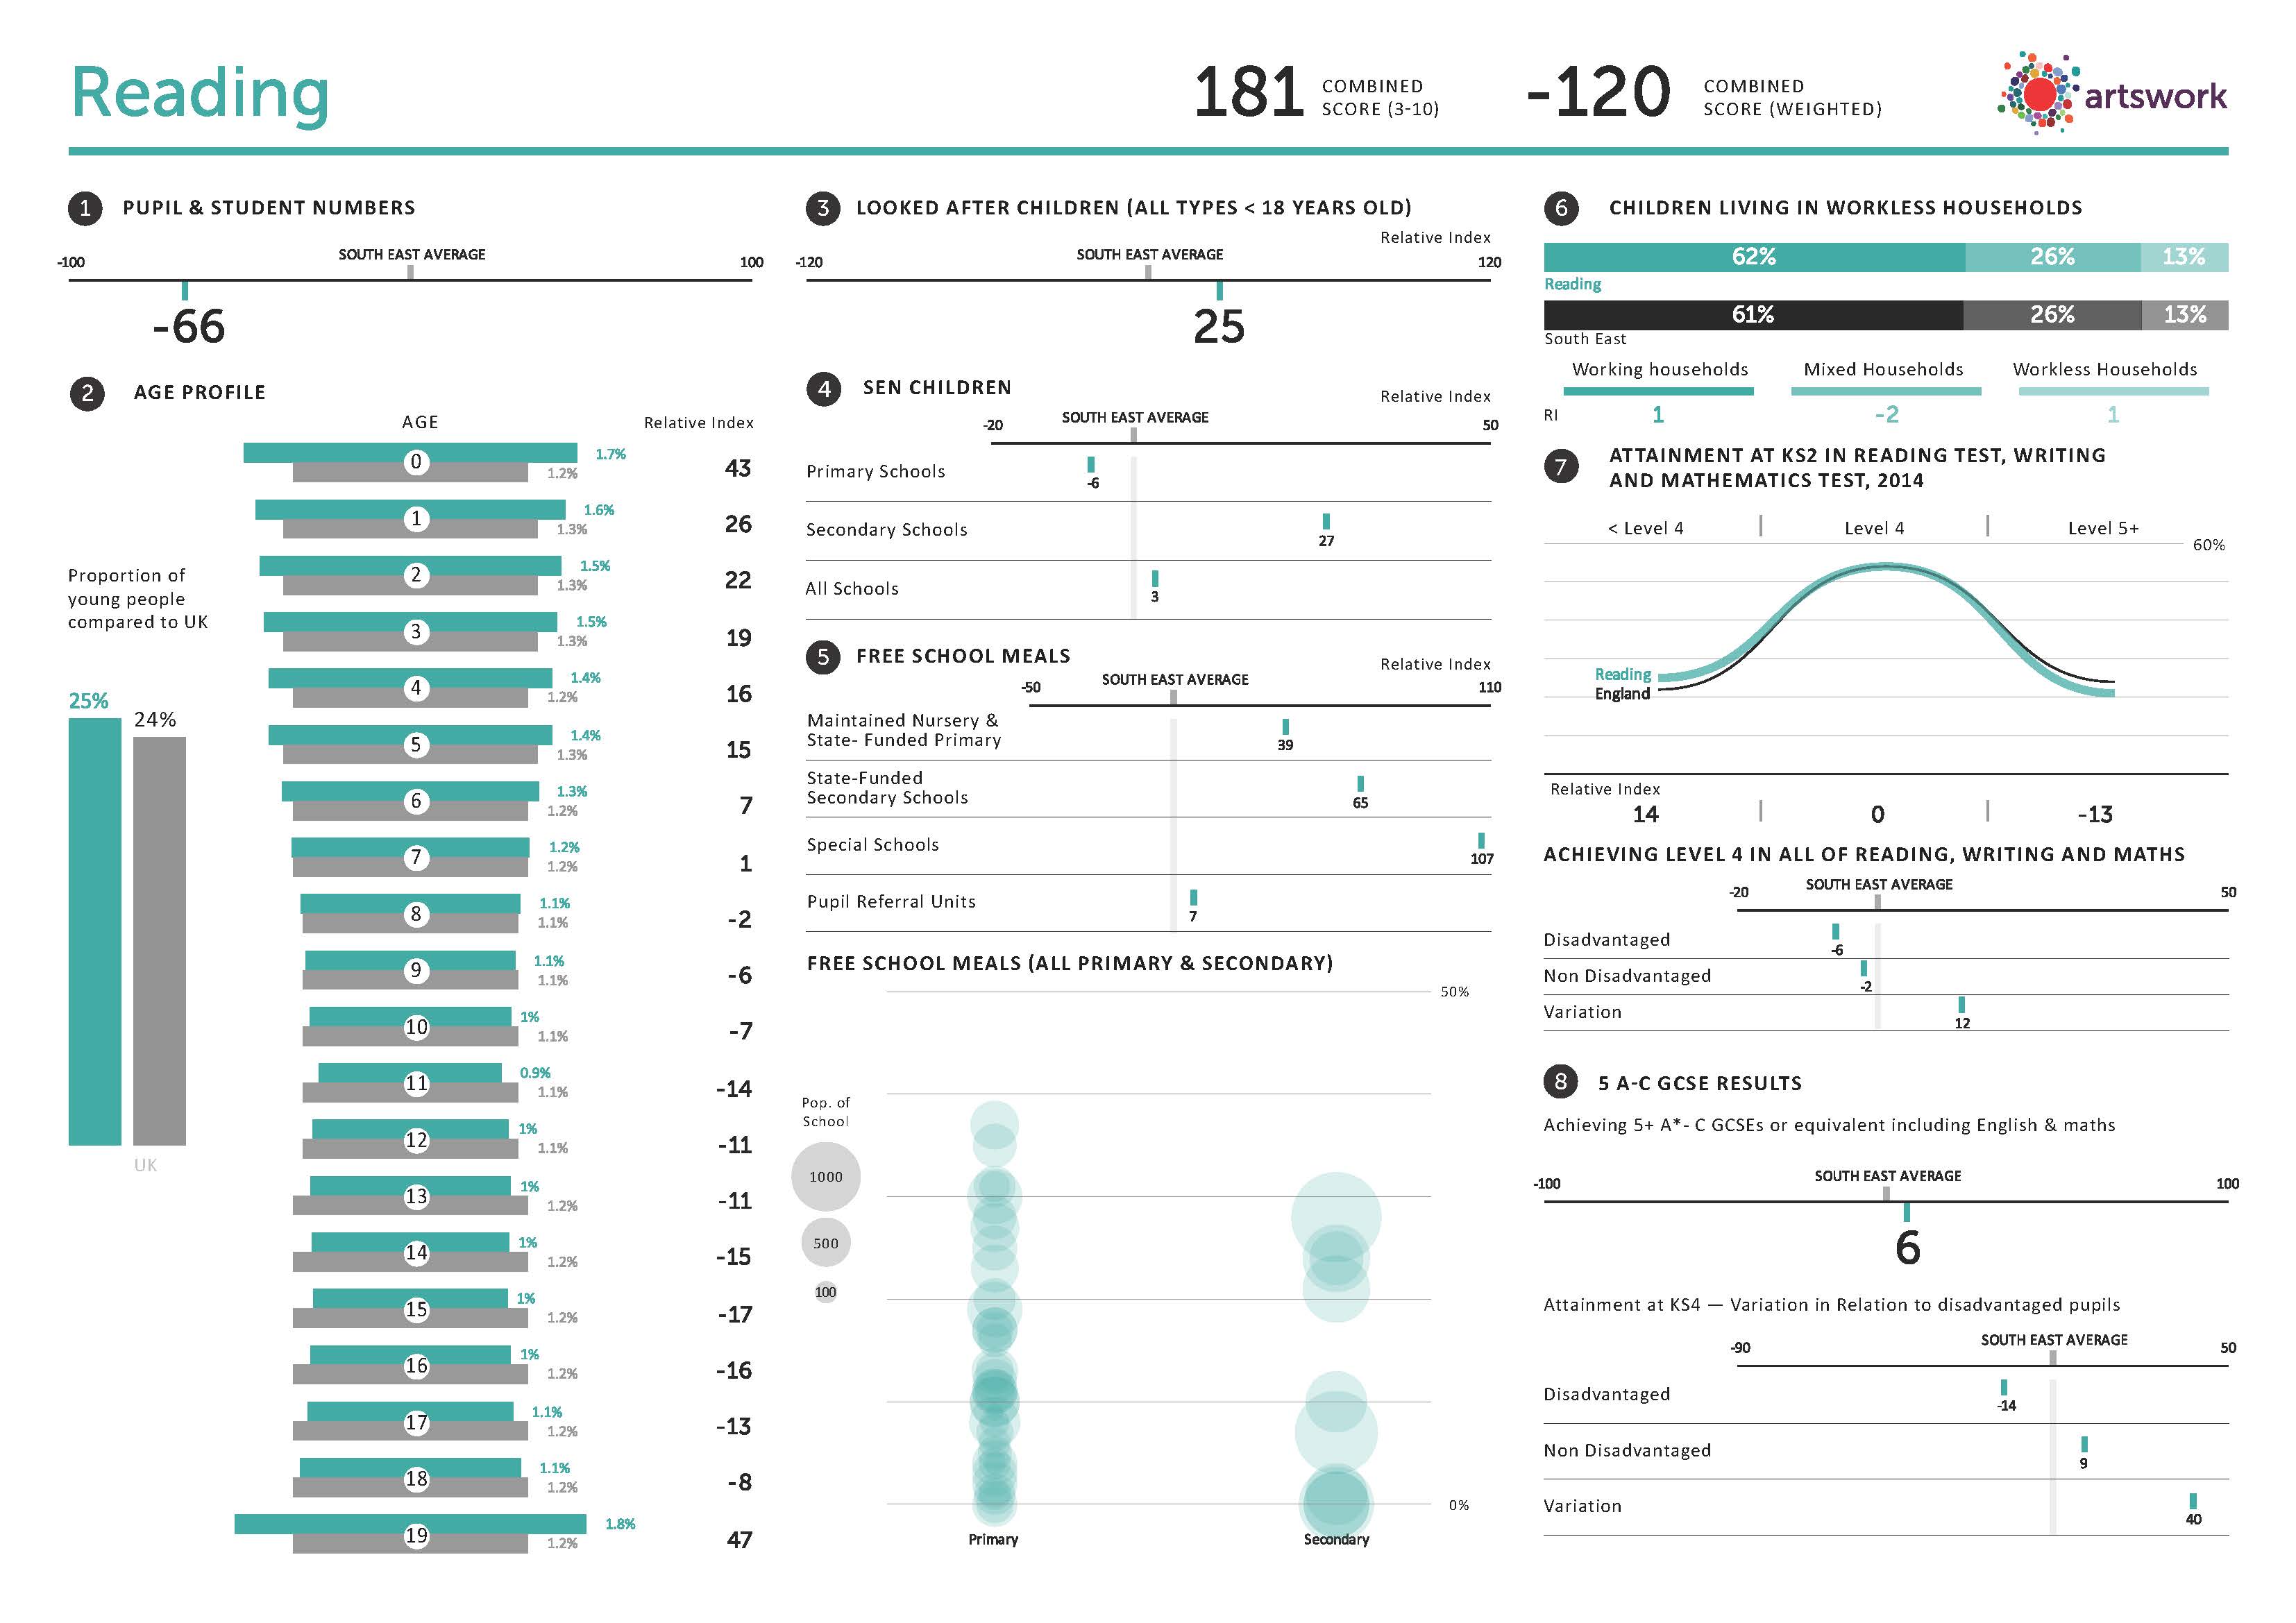
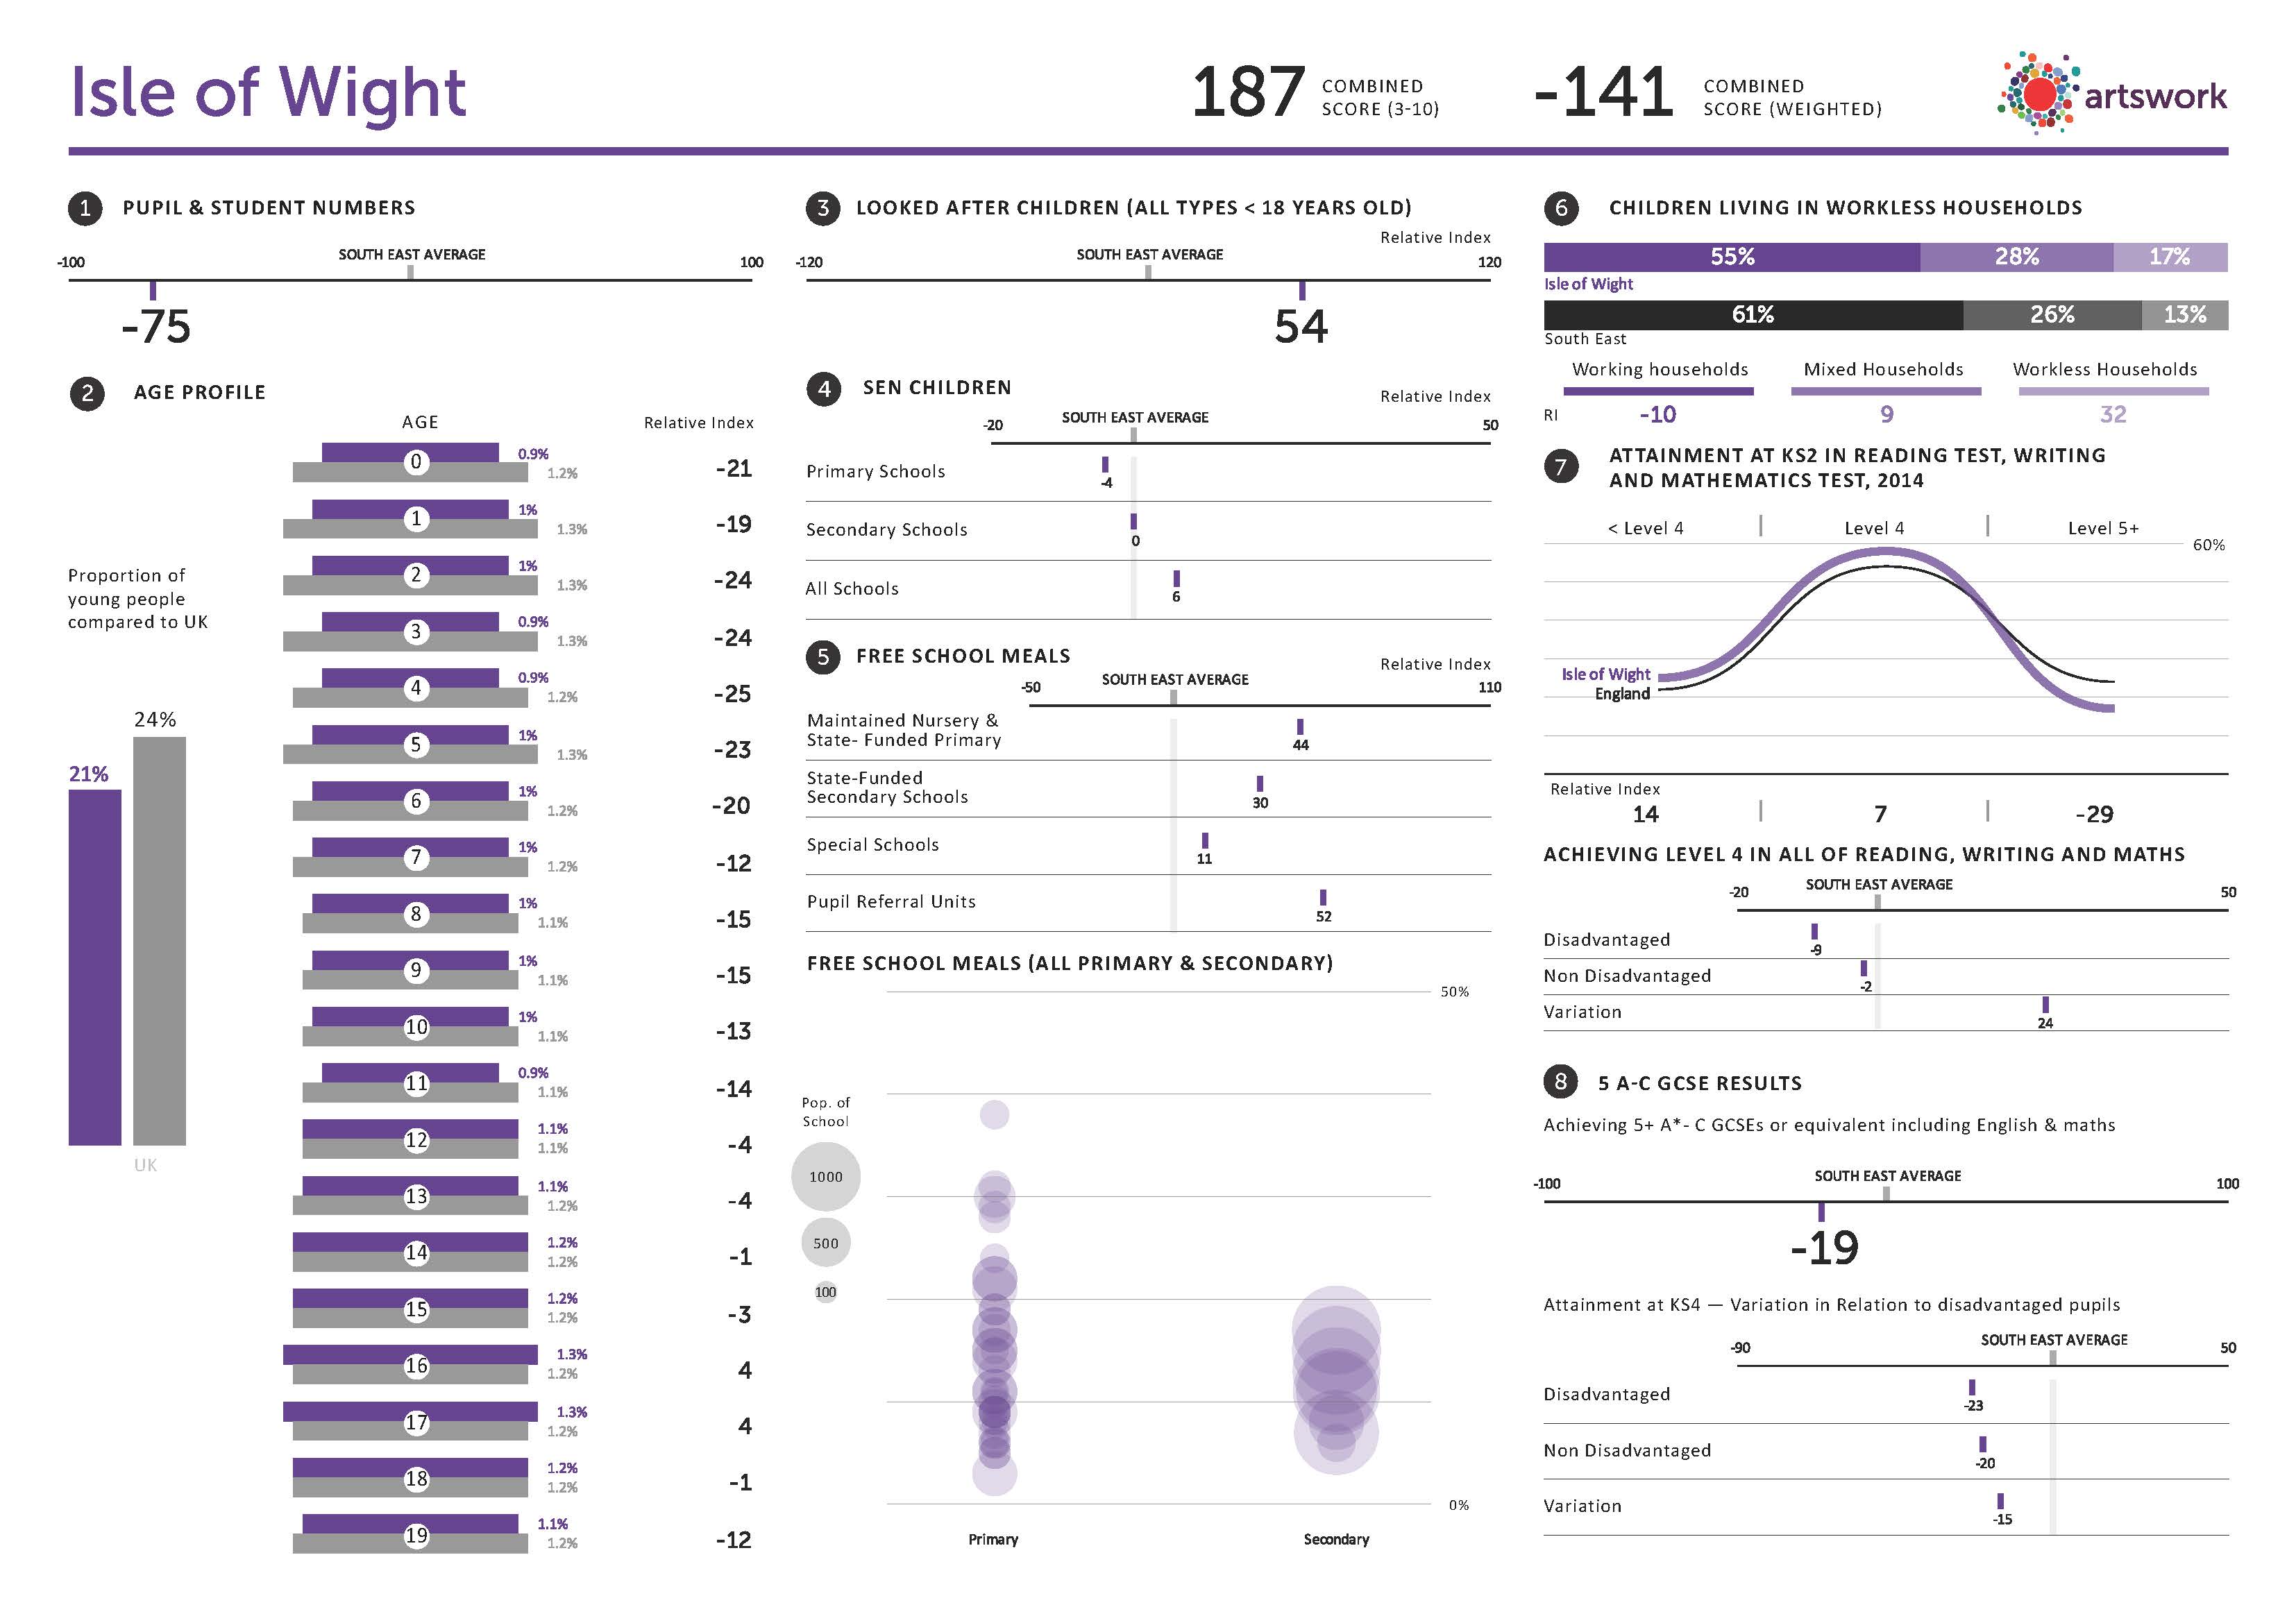
I have been developing a PDF graph generator as a hobby for a while. The purpose of this generator is to make lots of pages with identical layouts, but different data. Of course this can be done by hand (and I have done these things by hand). Which is why I never wanted to do them by hand ever again. I proposed that we use this PDF graph generator to represent data about the different regions that Artswork operates in. Most of the code was already in place for outputting the pages so all that was needed was a few custom graphs and the layout.
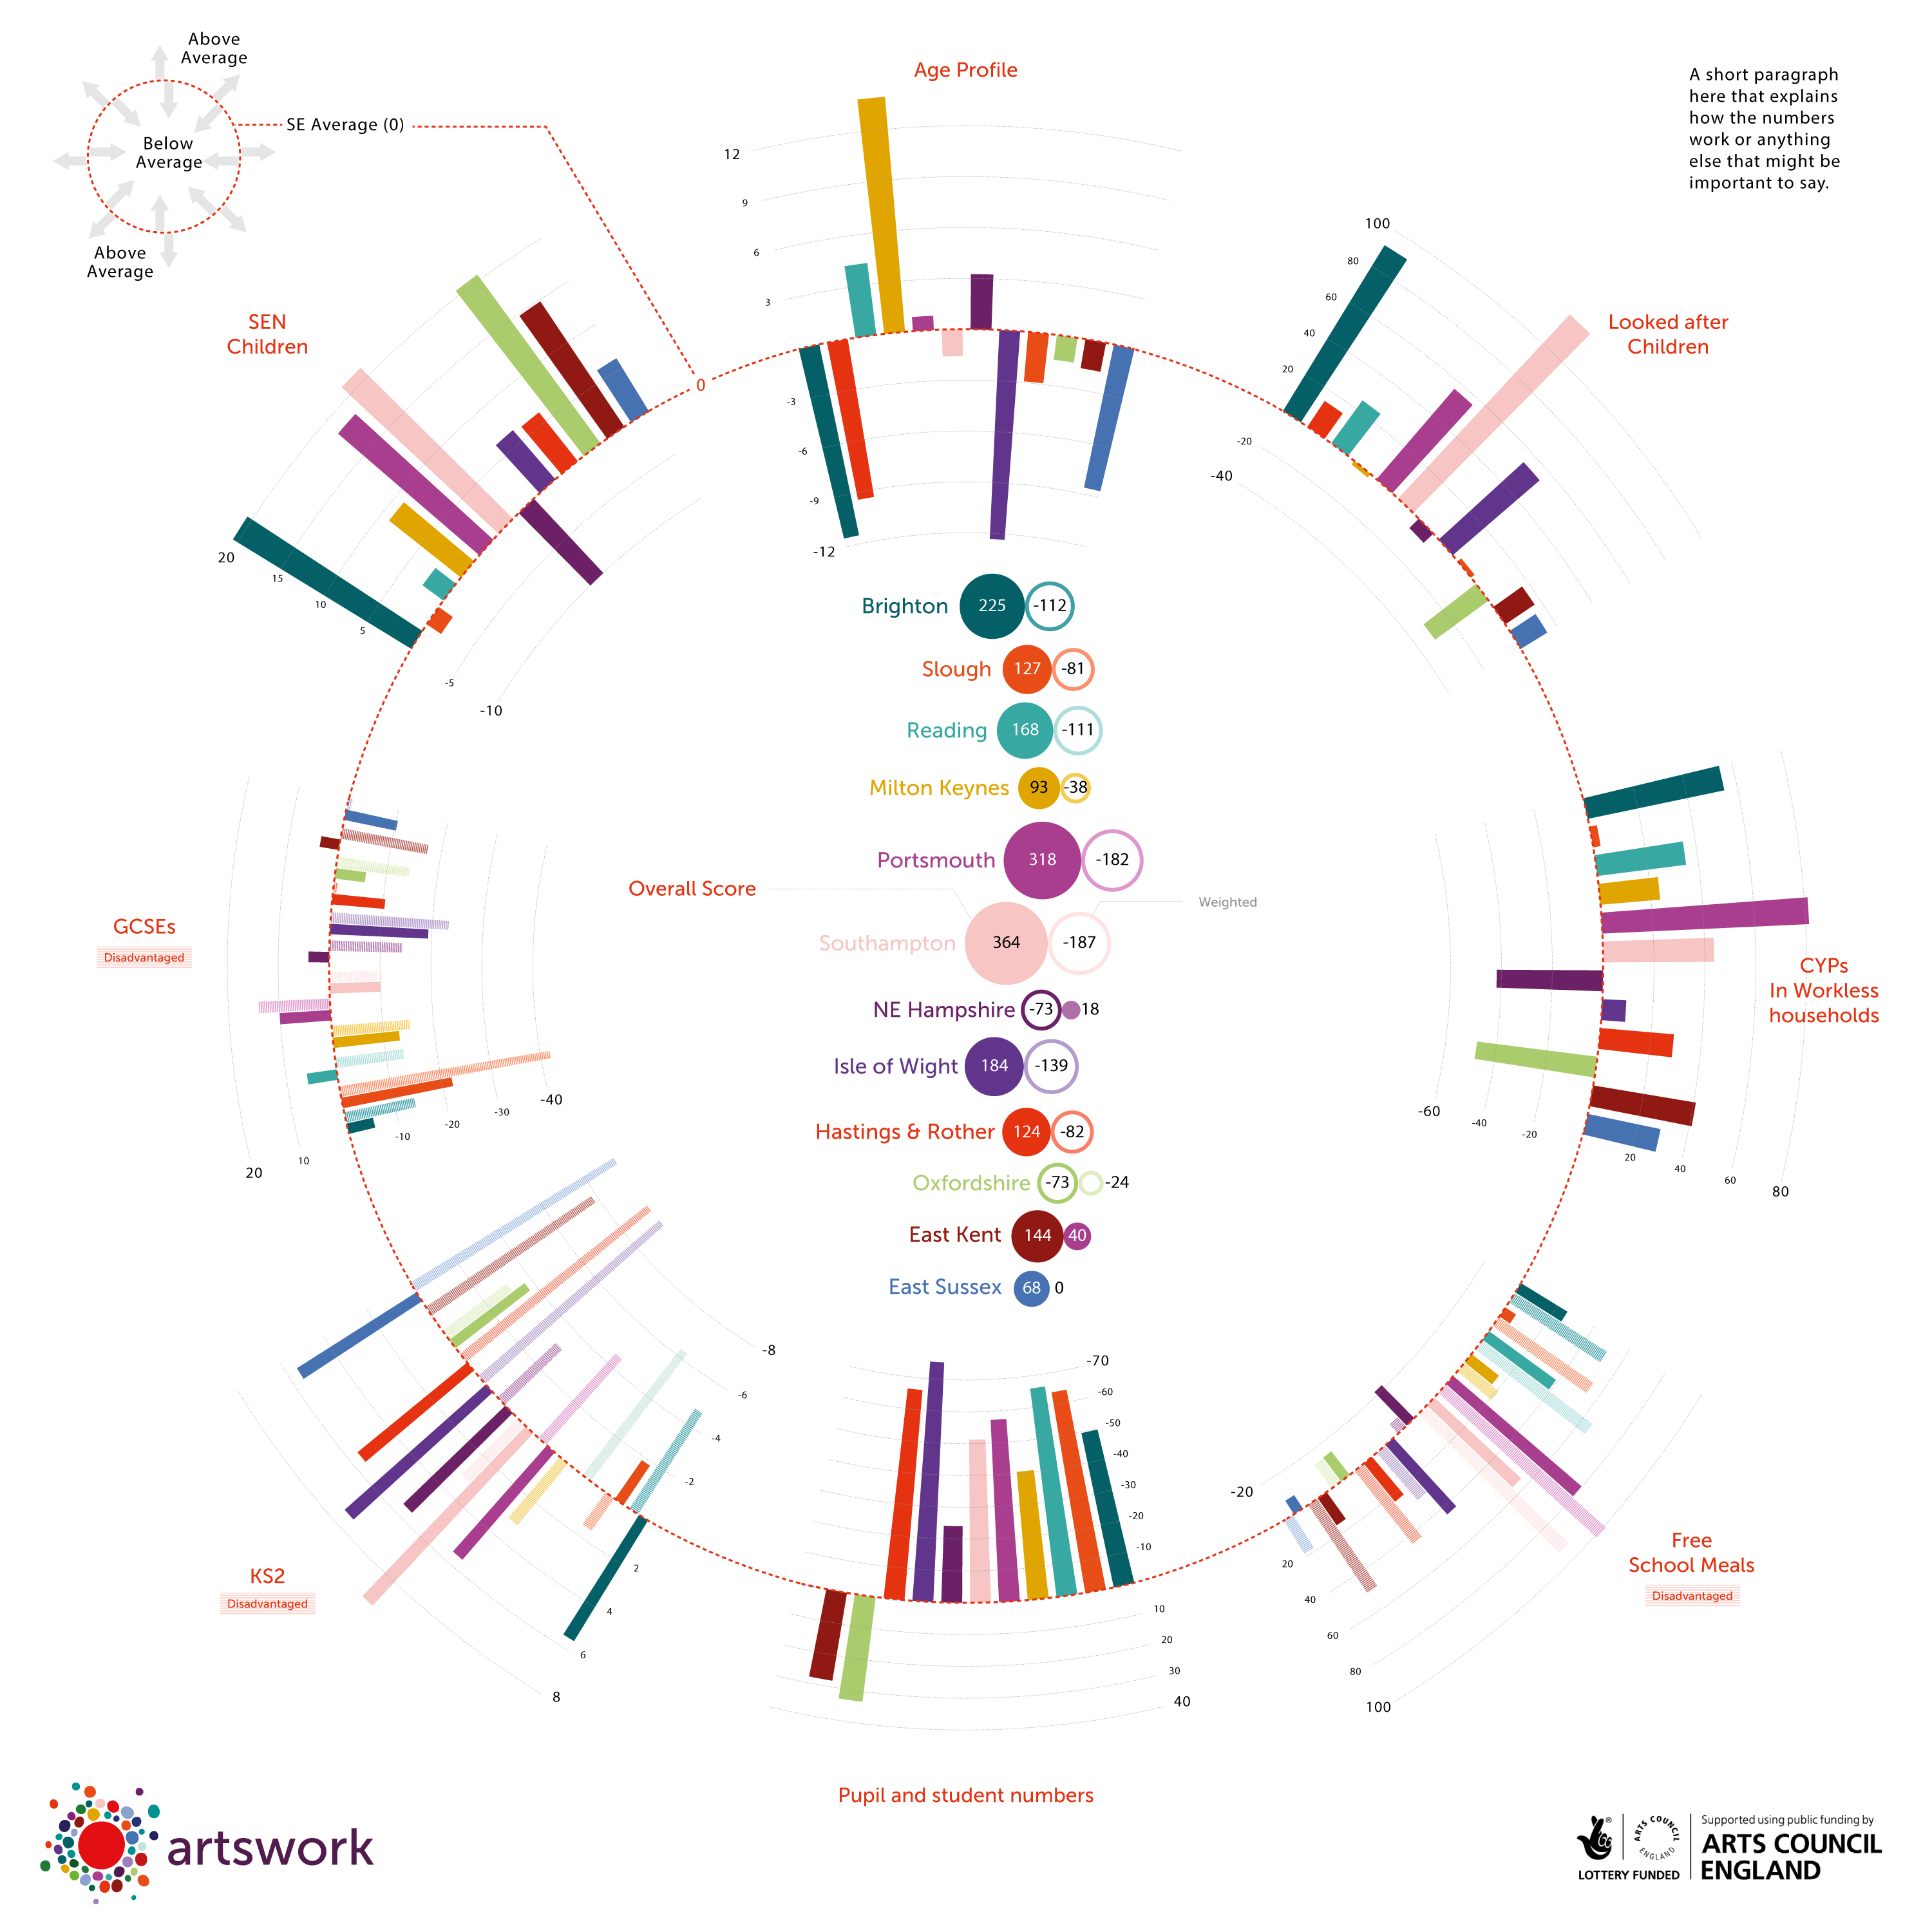
One of the most important reasons for me for making it all in code is that each of the regions is directly comporable with each other. This means that different regions can be compared at a glance! Again this is possible by hand, but it’s extremely labourious to update the graphs should there be any mistakes in the data.


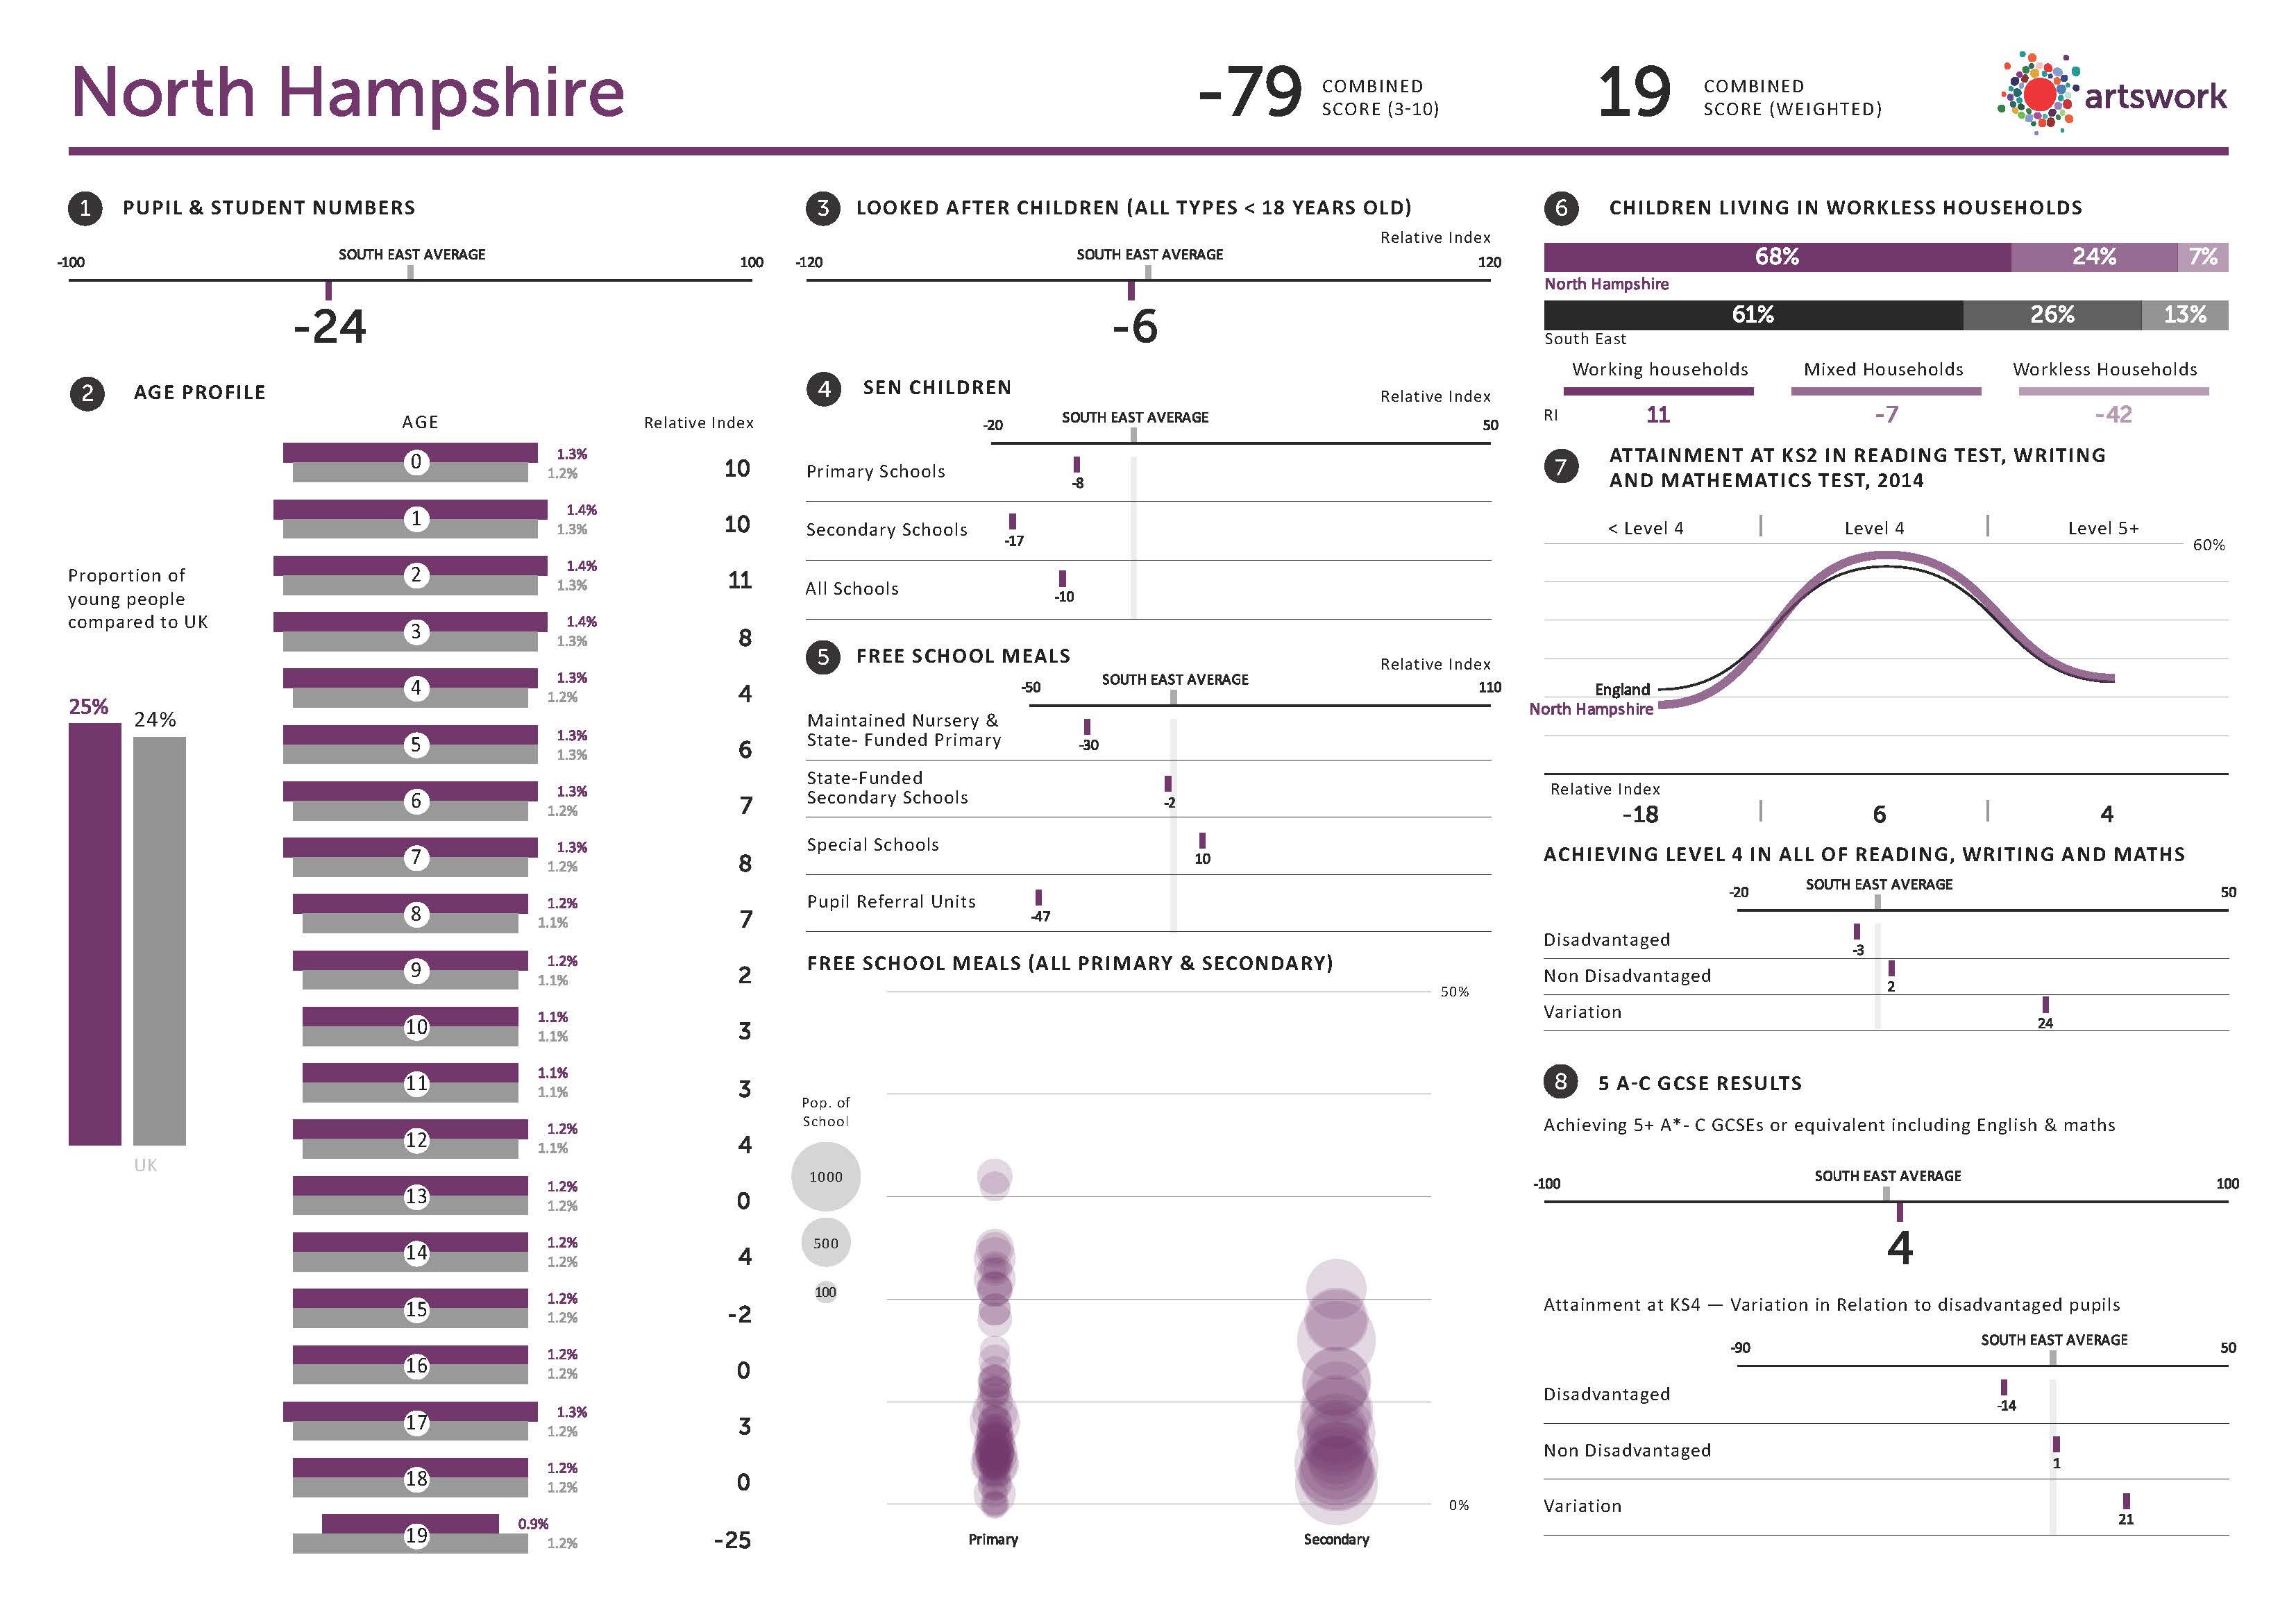
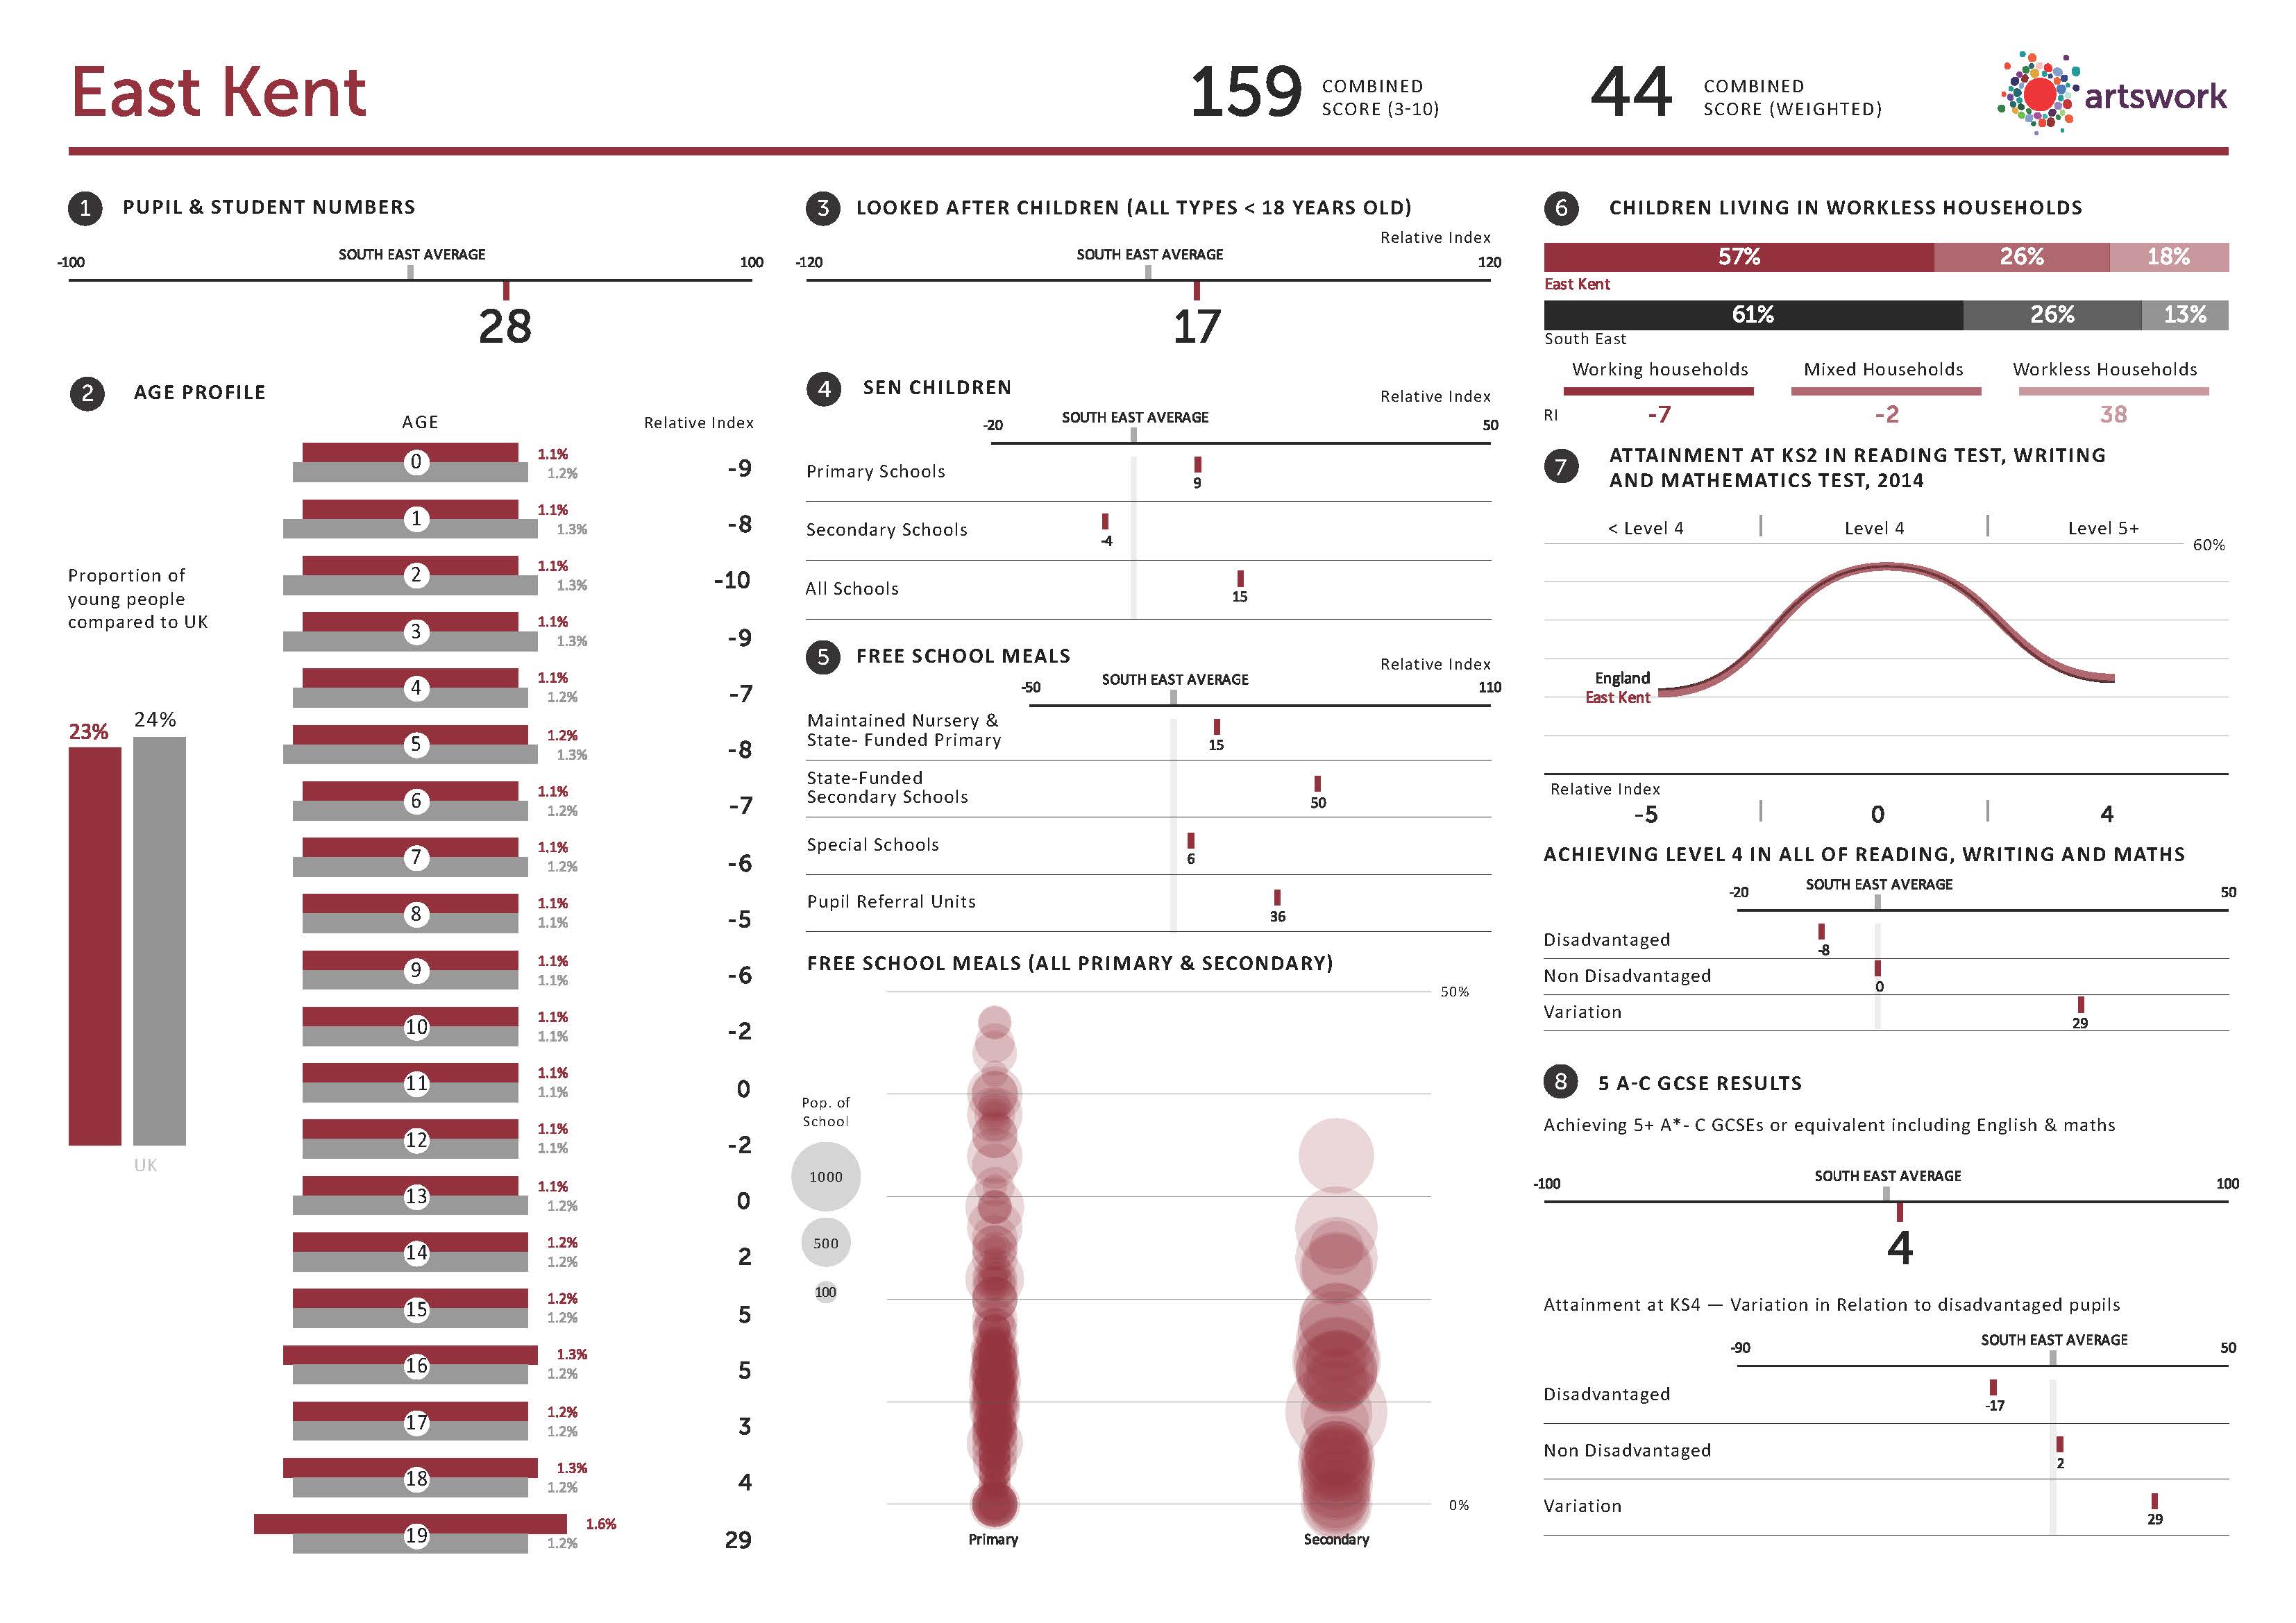

The original poster